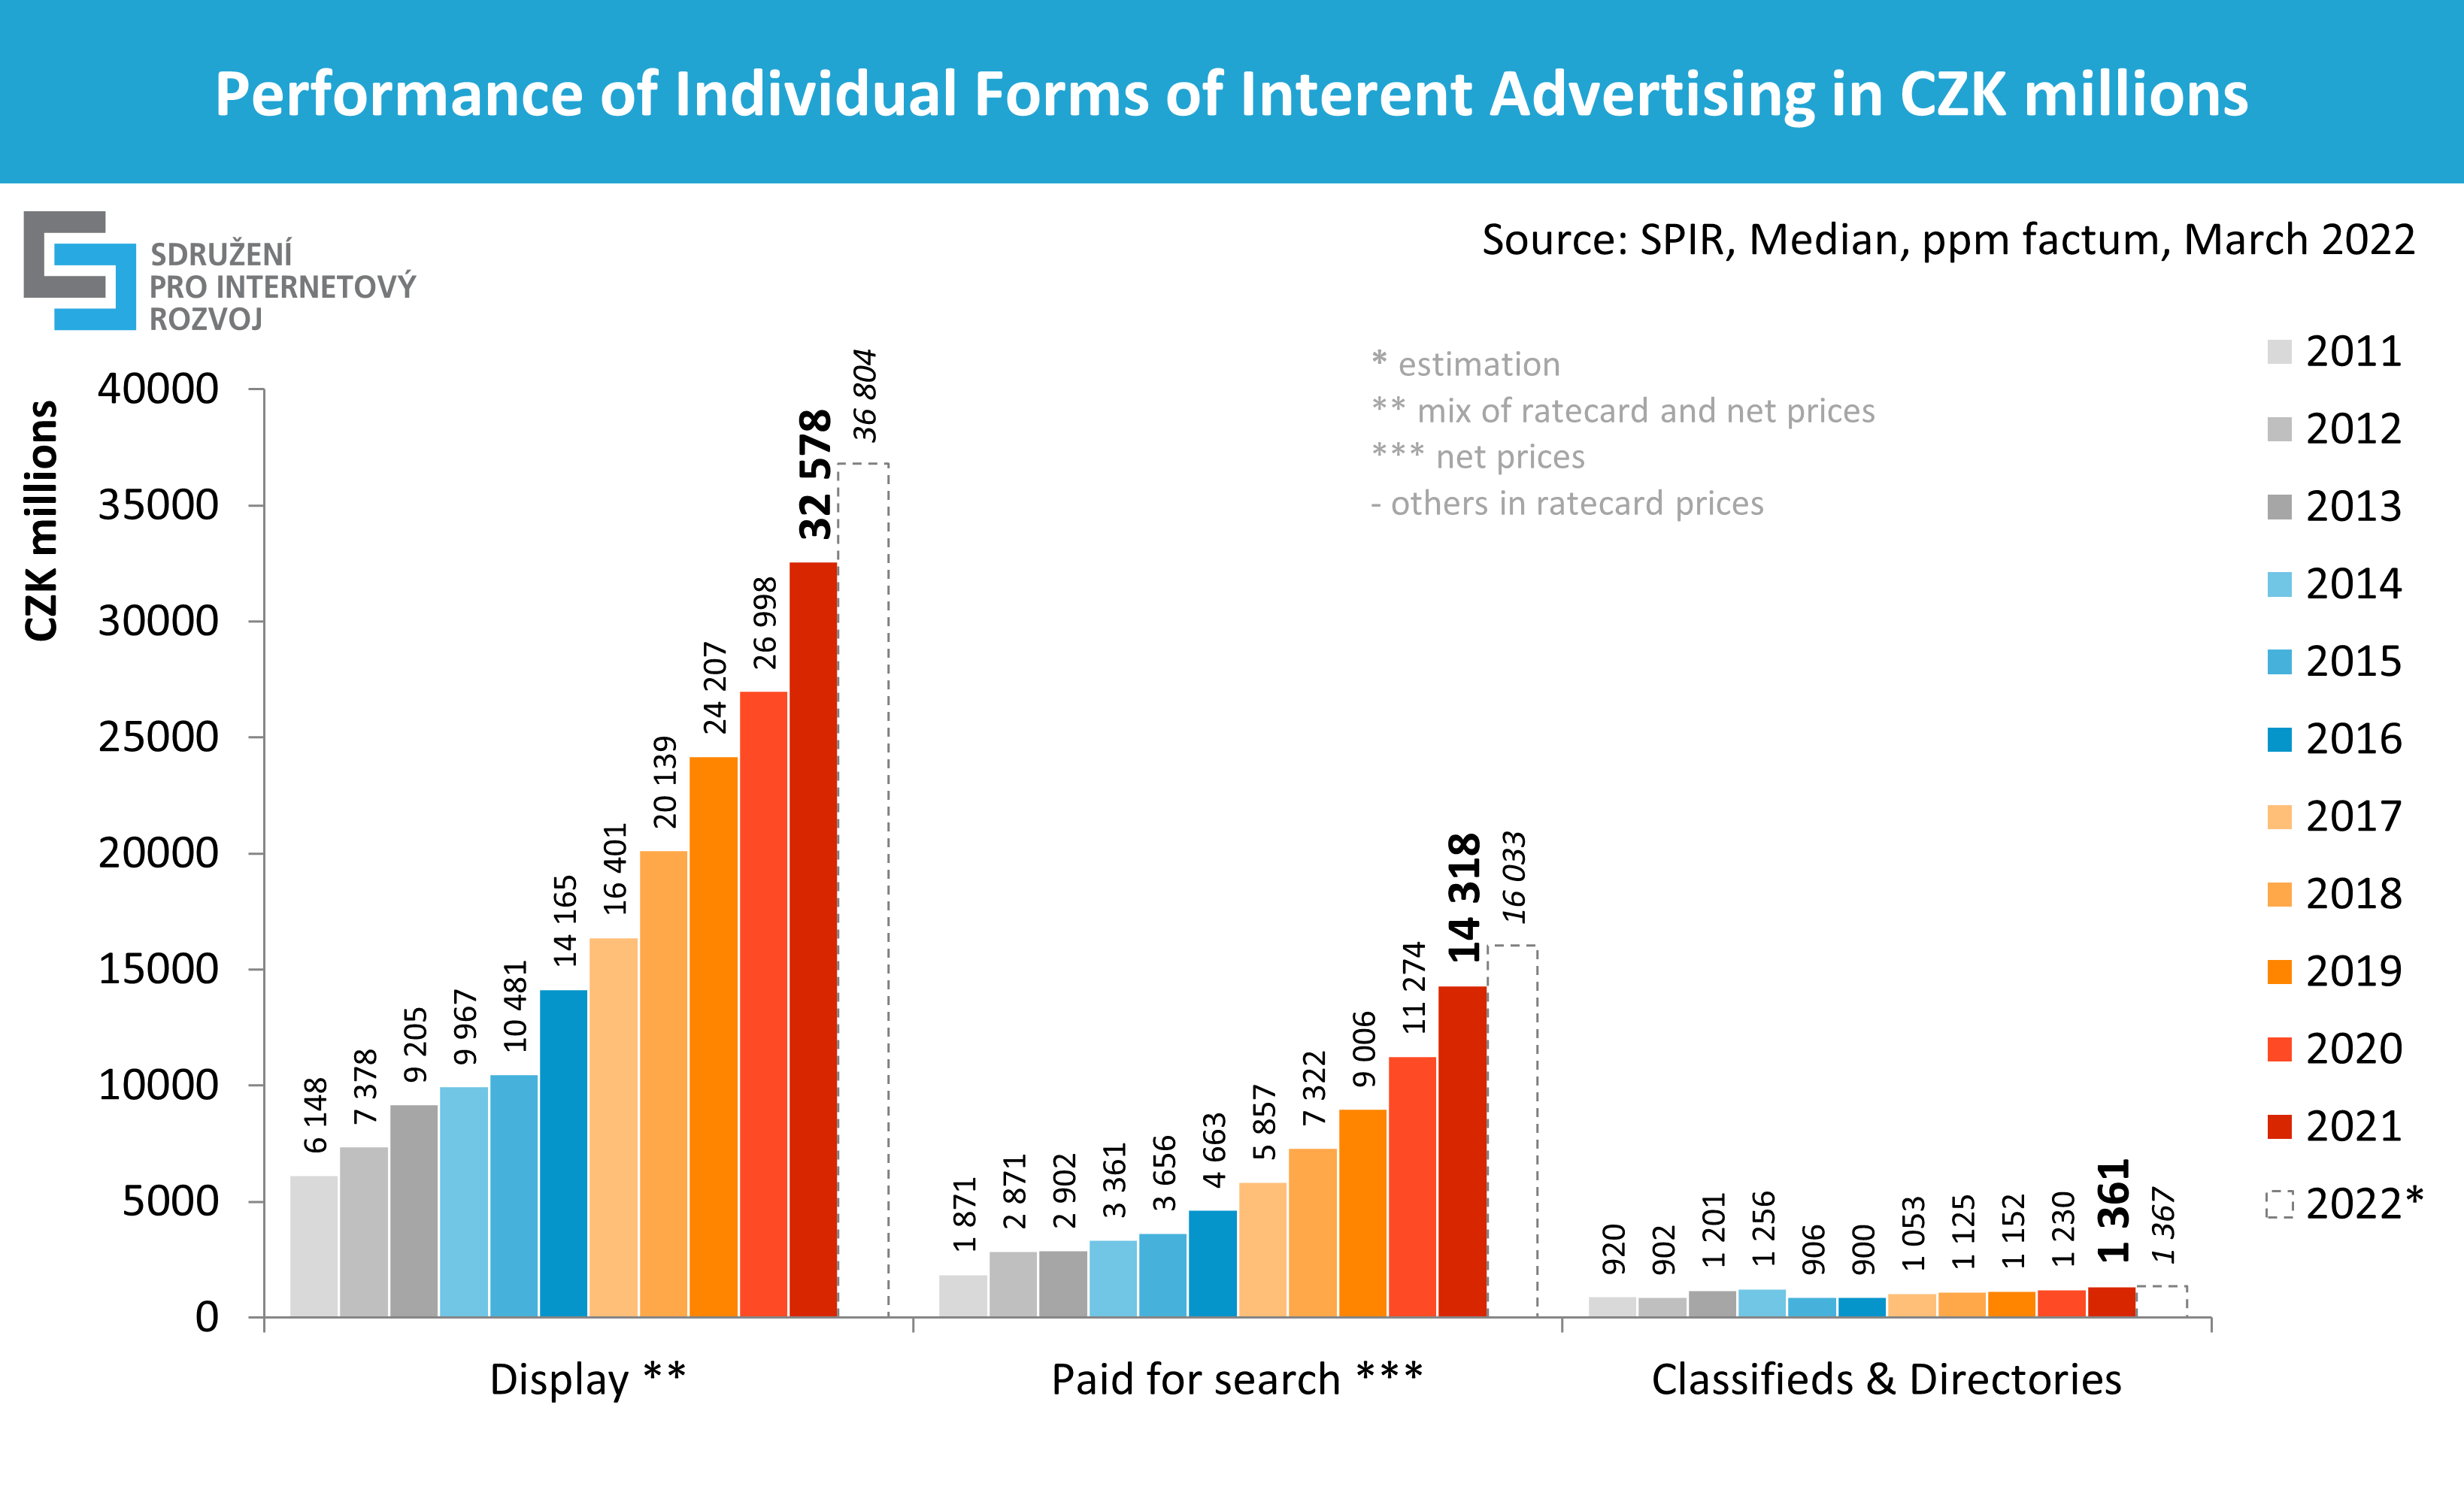
Share of individual forms of internet advertising in 2021
The largest part of advertising expenditures falls on display advertising (CZK 32.6 billion in combined prices).
Advertising in content networks (especially the Seznam Sklik, Google Ads and Facebook networks), RTB way traded advertising and native advertising are also included in the display advertising.
The second most used form of advertising is paid search advertising, in which advertisers have invested CZK 14.3 billion in net prices.
For classifieds and directories advertising, the media declared revenues of CZK 1.4 billion in ratecard prices.
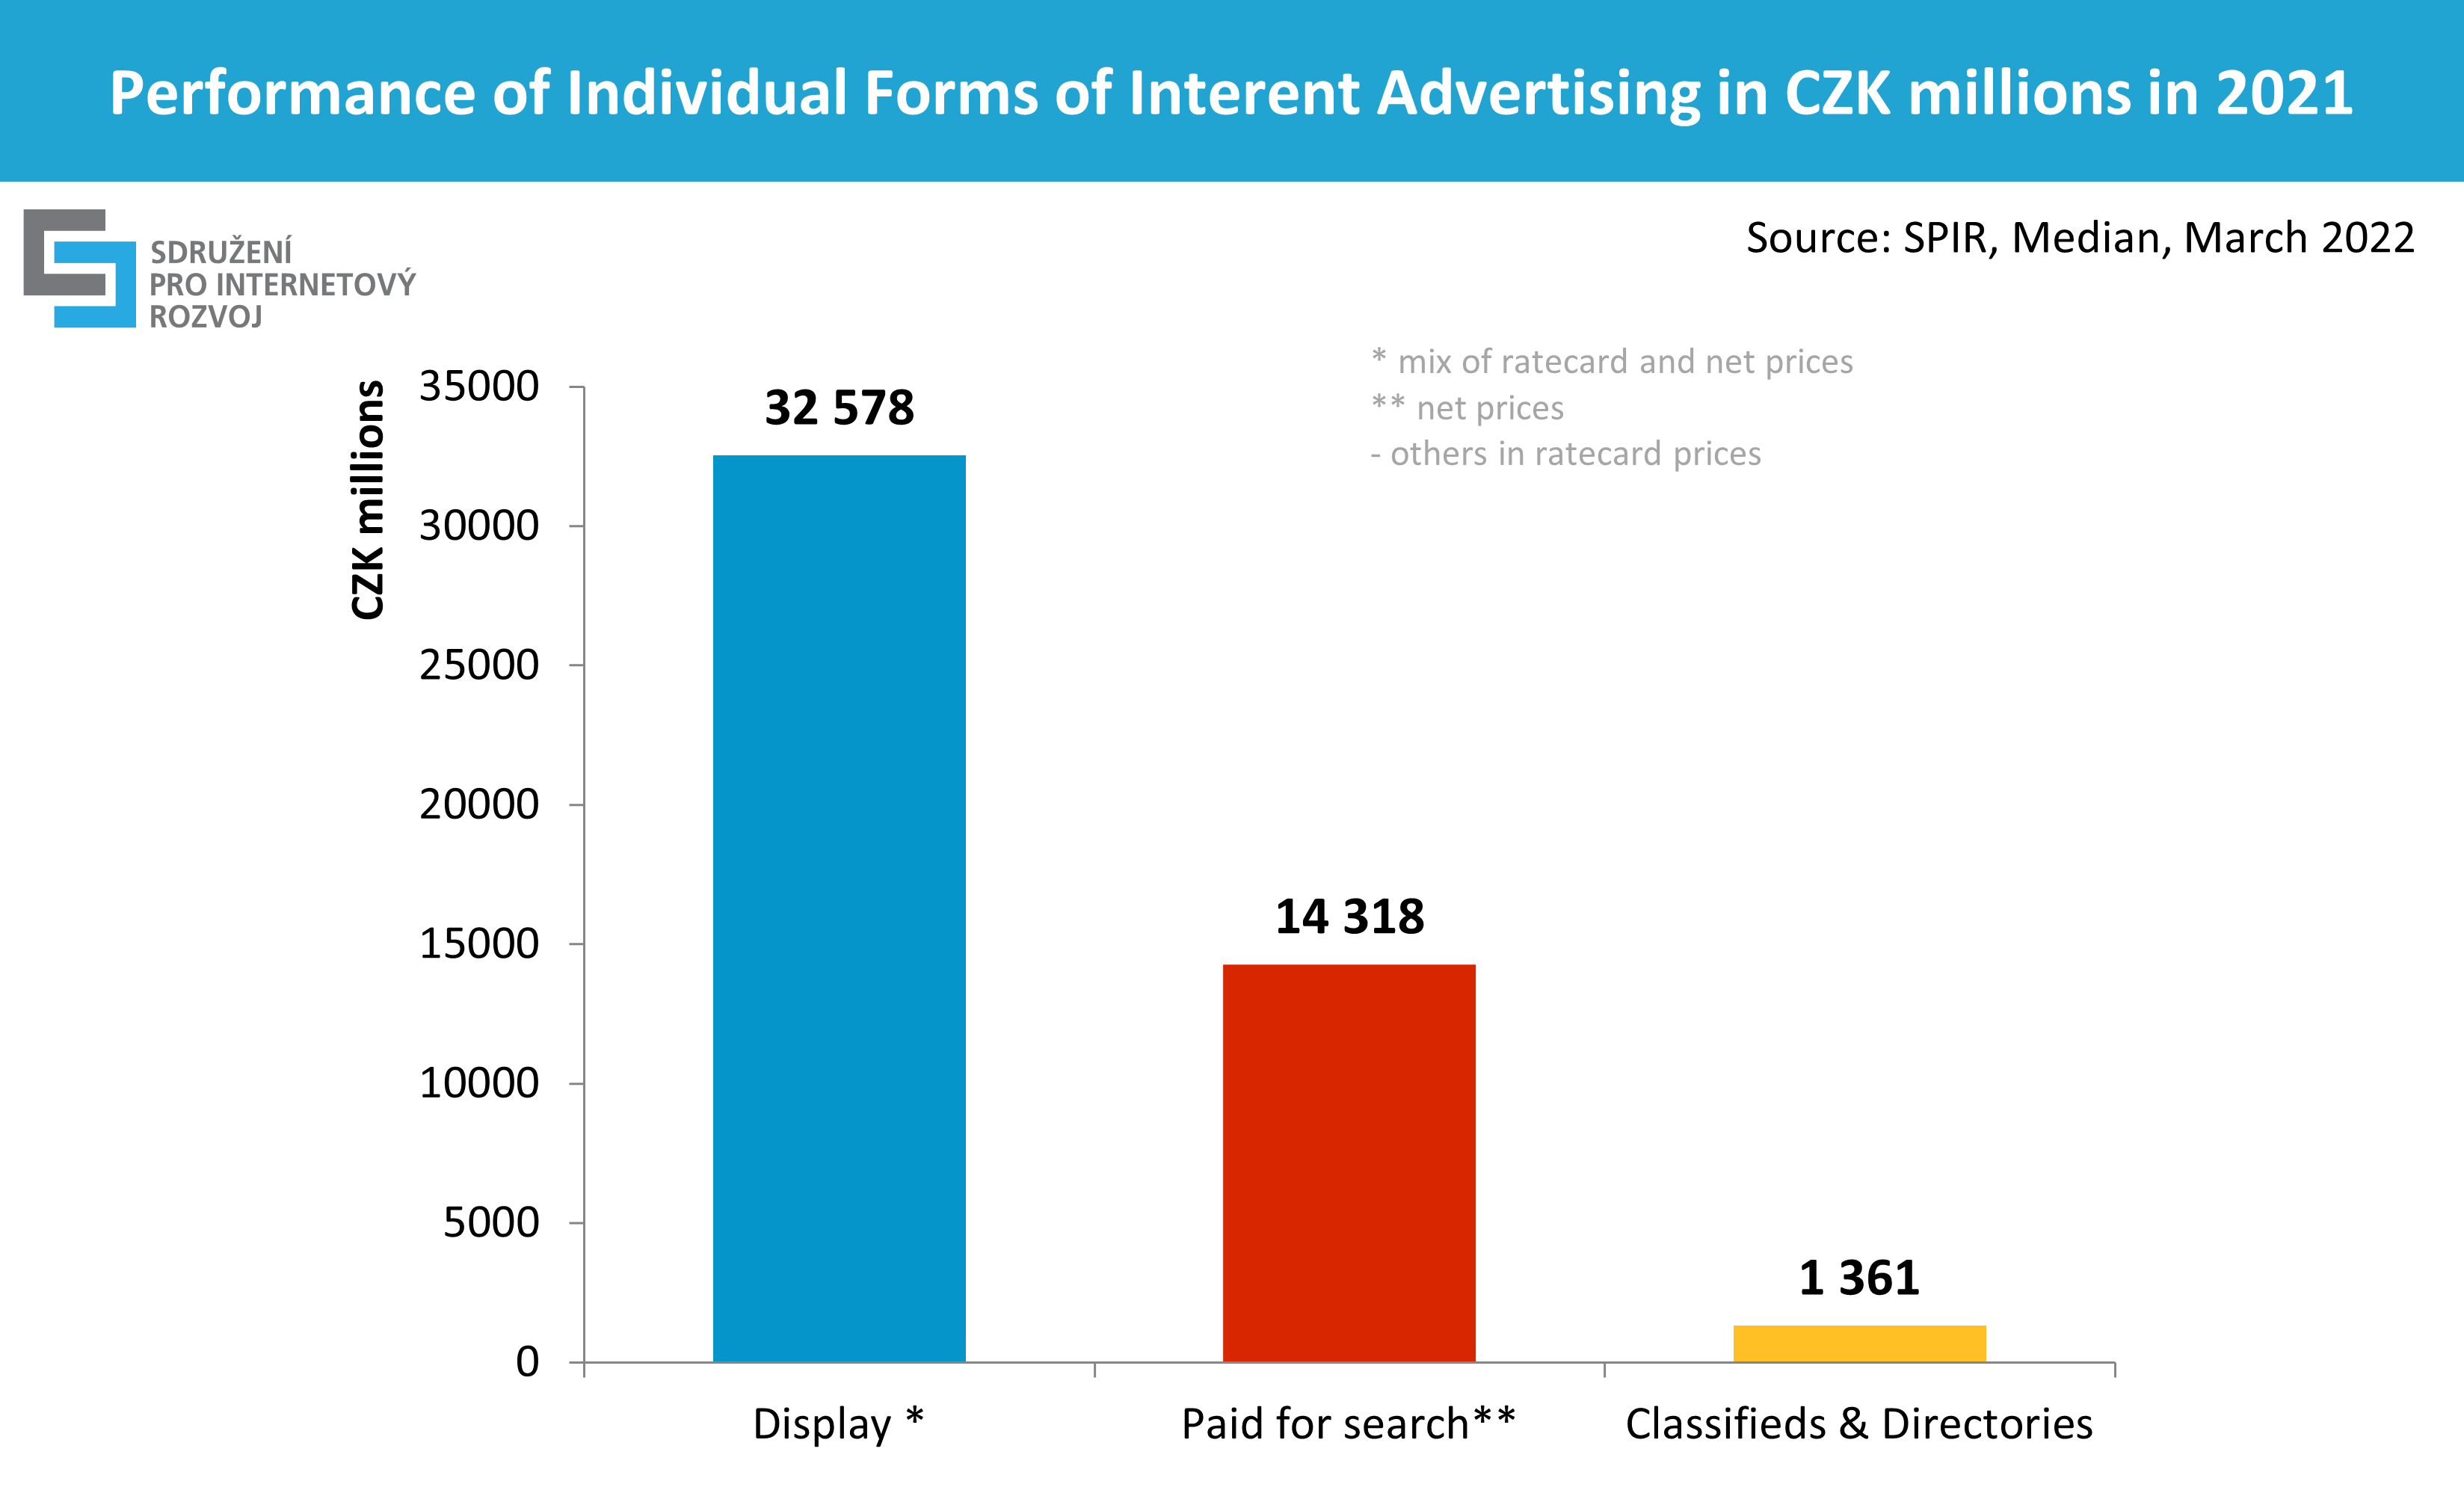 Source: SPIR, MEDIAN, March 2022
* mix of ratecard and net prices
** net prices
- others in ratecard prices
Video advertising accounted for 26% of the total display advertising (CZK 8.5 billion), increased by 11% year-on-year and is estimated to grow by 14% this year.
Native advertising accounted for 11% (CZK 3.6 billion), increased by 15% year on year and is estimated to grow by 11% this year.
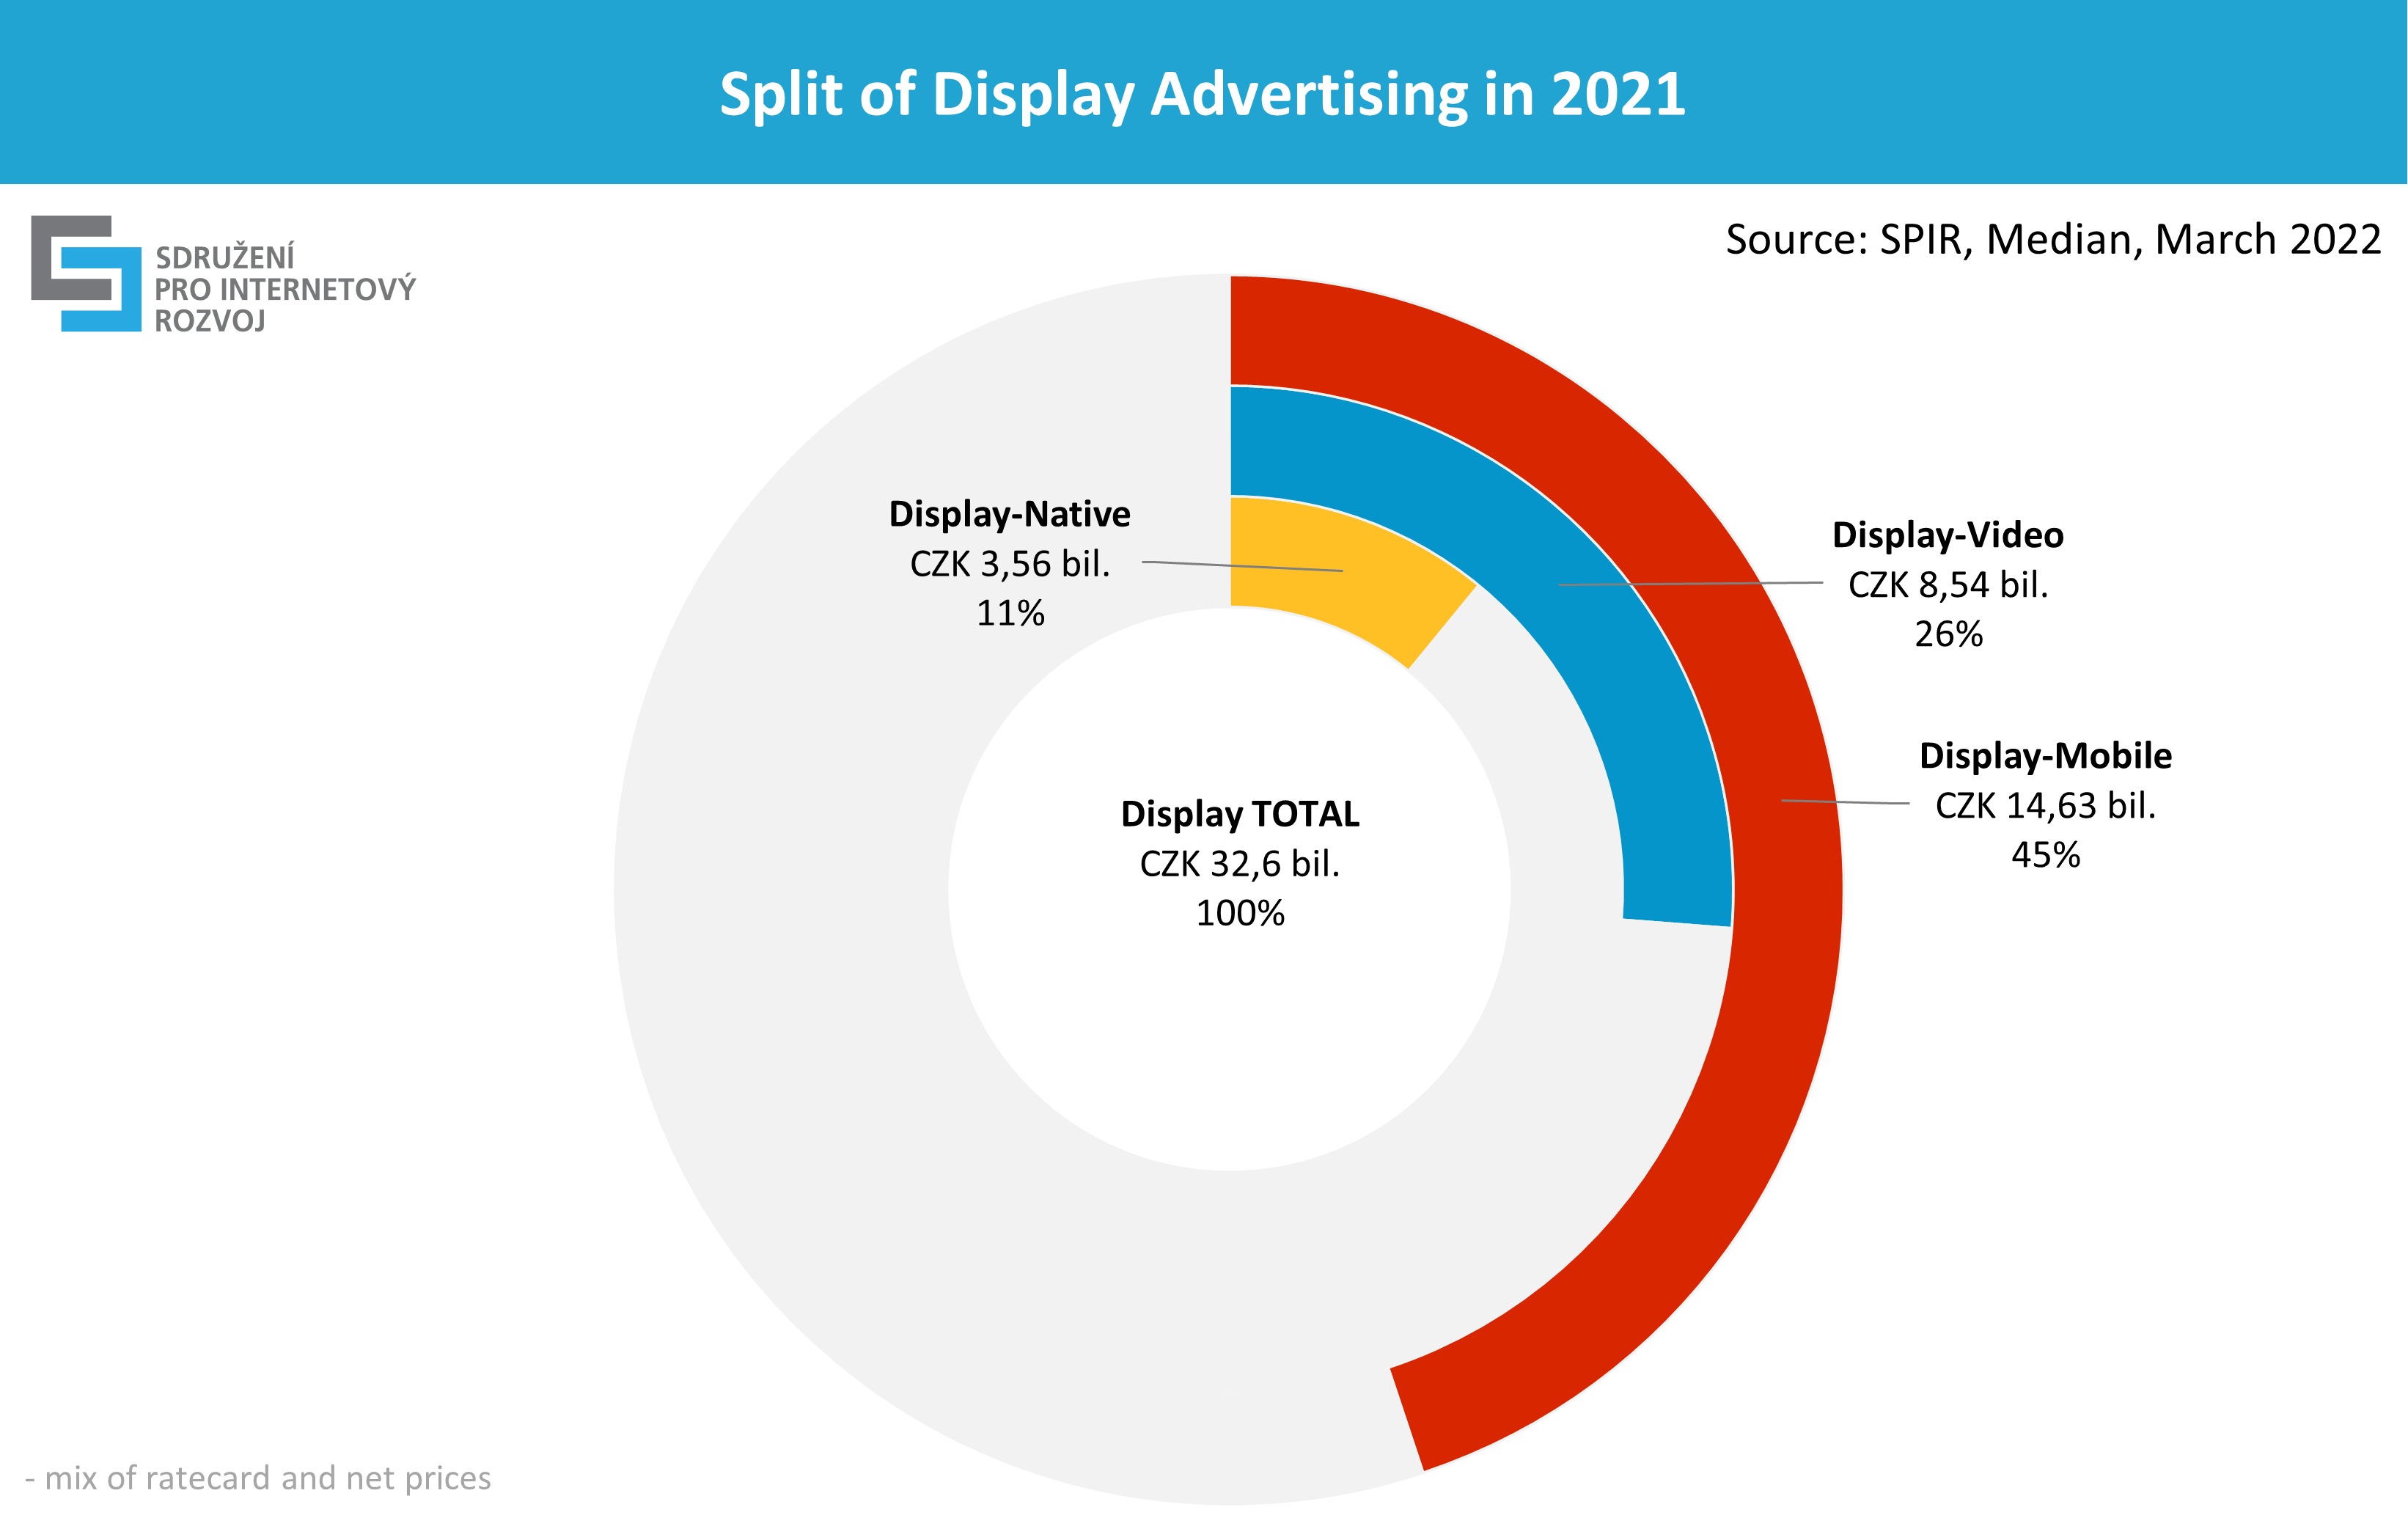 Source: SPIR, MEDIAN, March 2022
– mix of ratecard and net prices
The share of mobile display advertising (mobile ads and mobile targeted ads) in the total display advertising was 45% (CZK 14.6 billion), an increase of 45% year-on-year
and an estimated 15% growth for this year.
Programmatically traded advertising, which relates to content networks and RTB, together accounted for 65% of the entire display advertising (CZK 21 billion)
and increased by 25% year-on-year. The estimate for this year is growth of 13%.
The programmatic display includes the advertising performance of content networks (such as Seznam Sklik, Google Ads, Facebook, Instagram and others) as well as the performance of advertising through DSP / SSP systems.
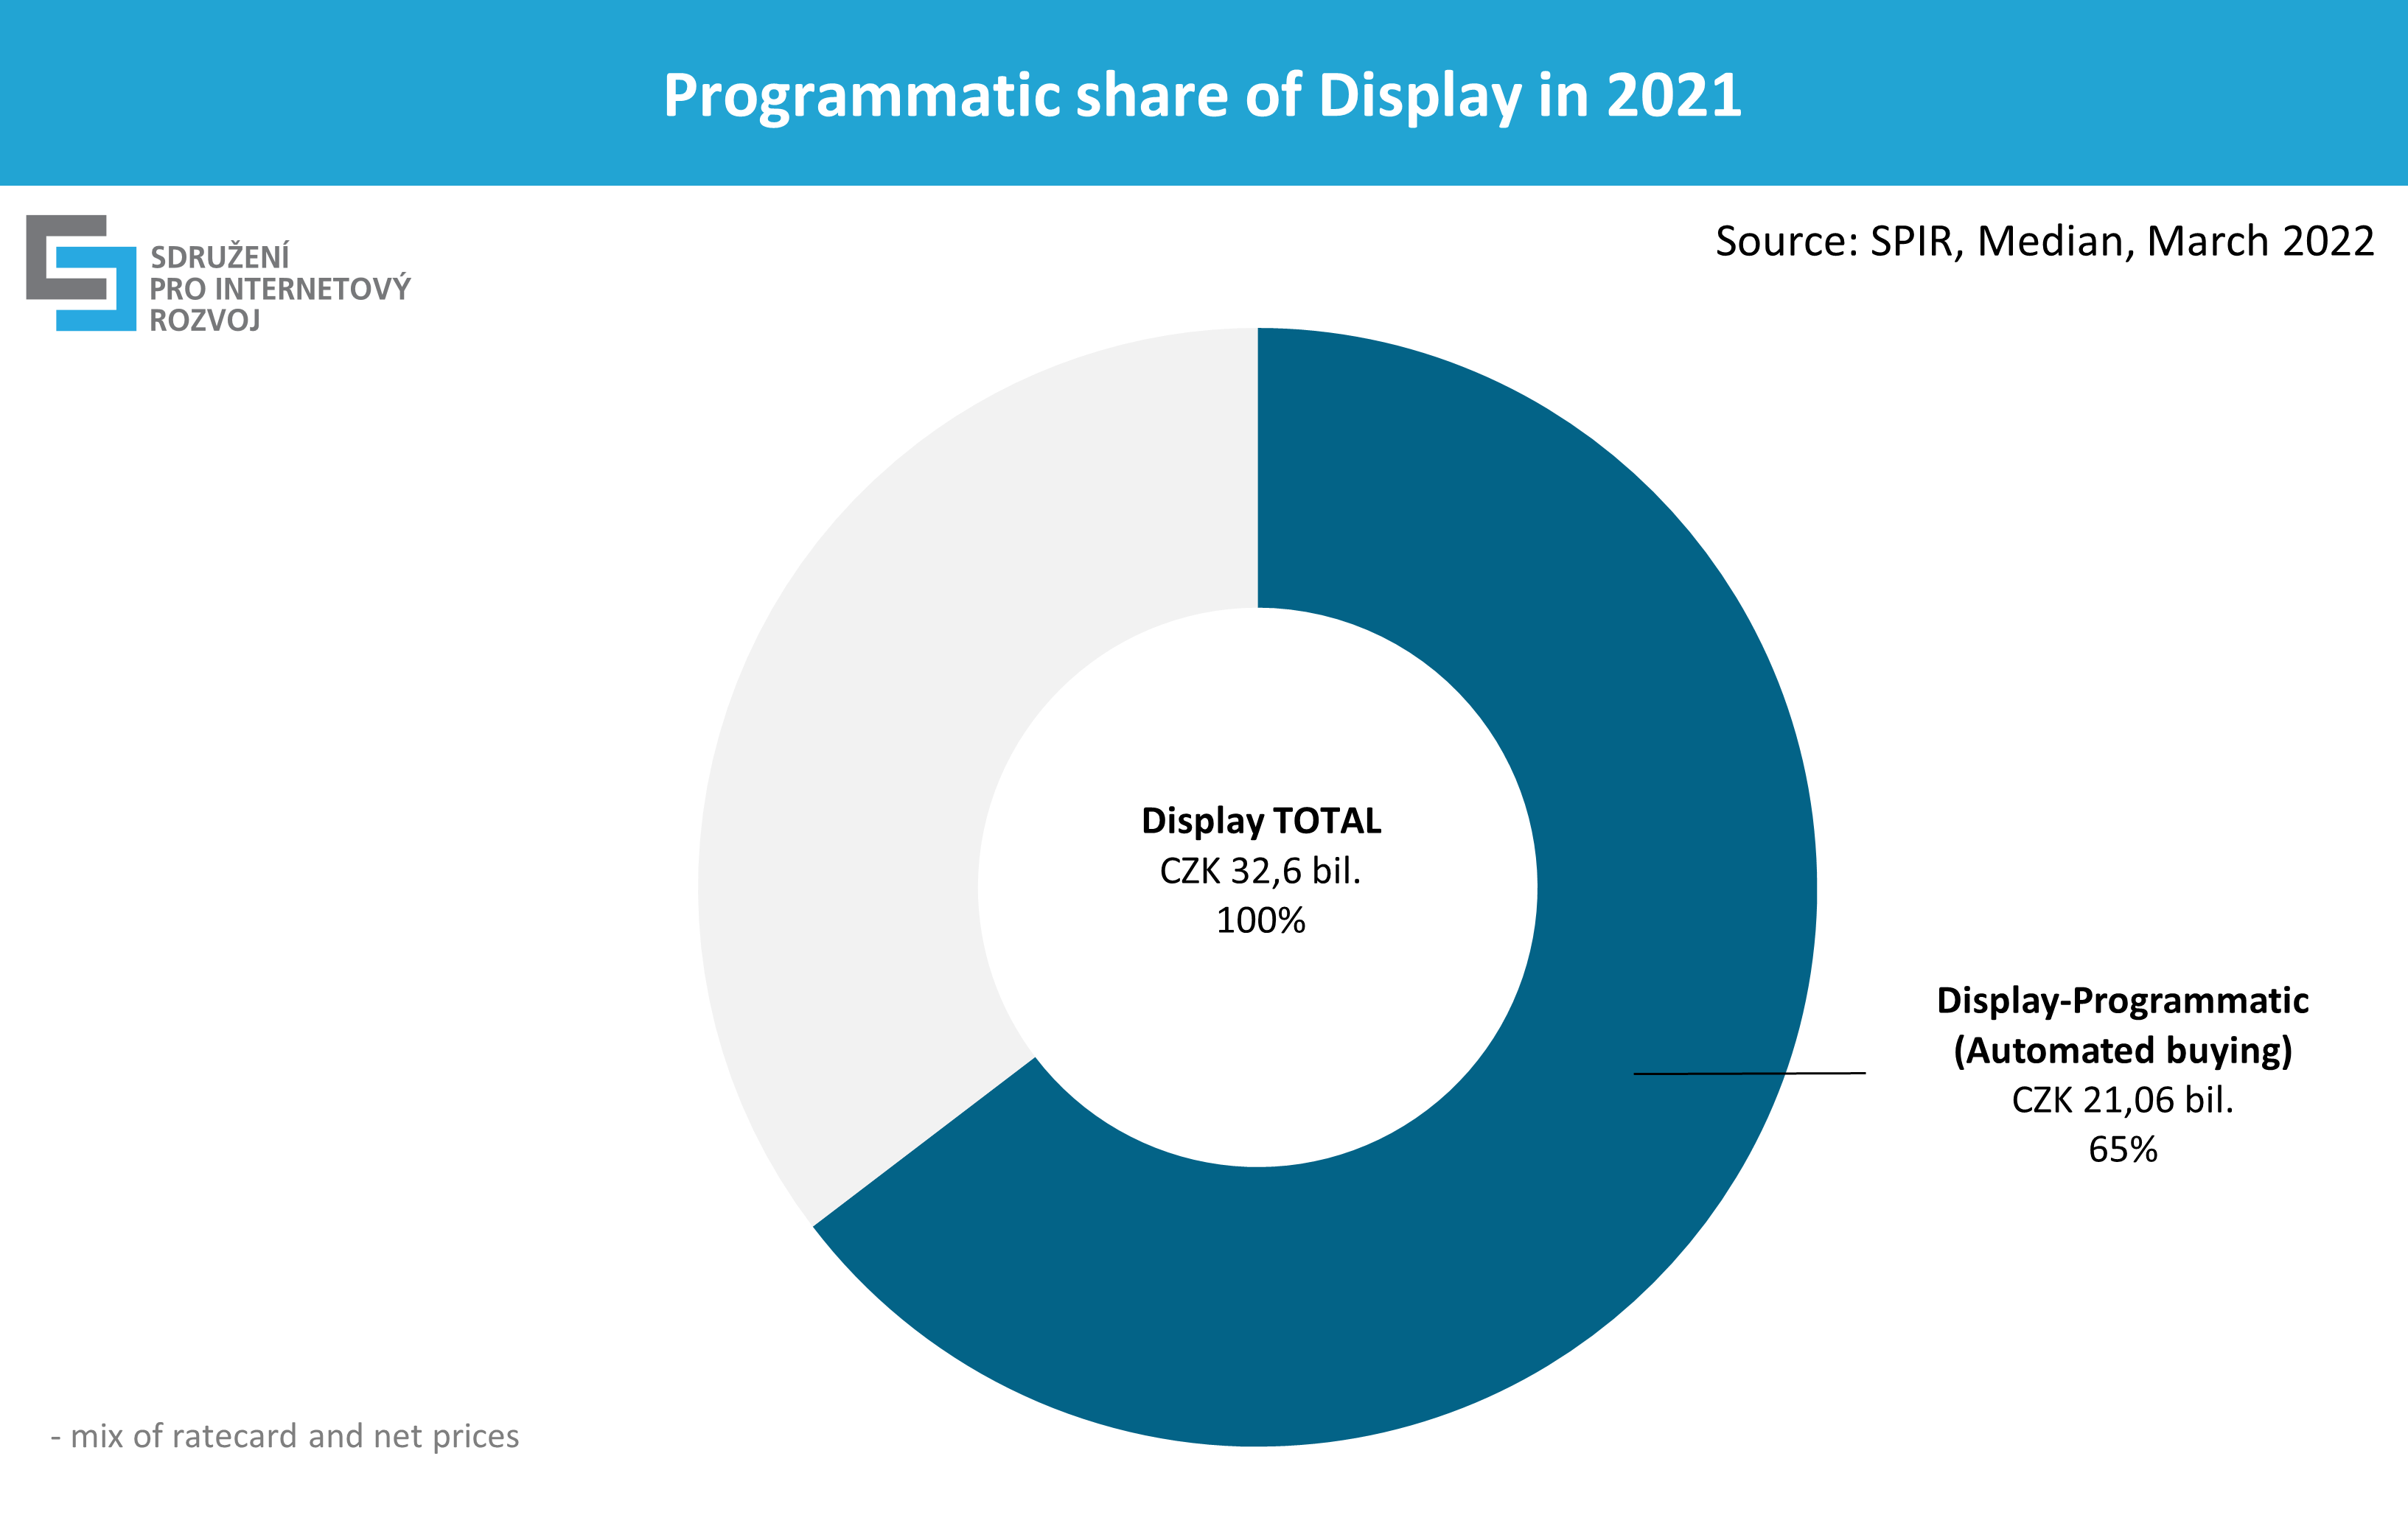 Source: SPIR, MEDIAN, March 2022
– mix of ratecard and net prices
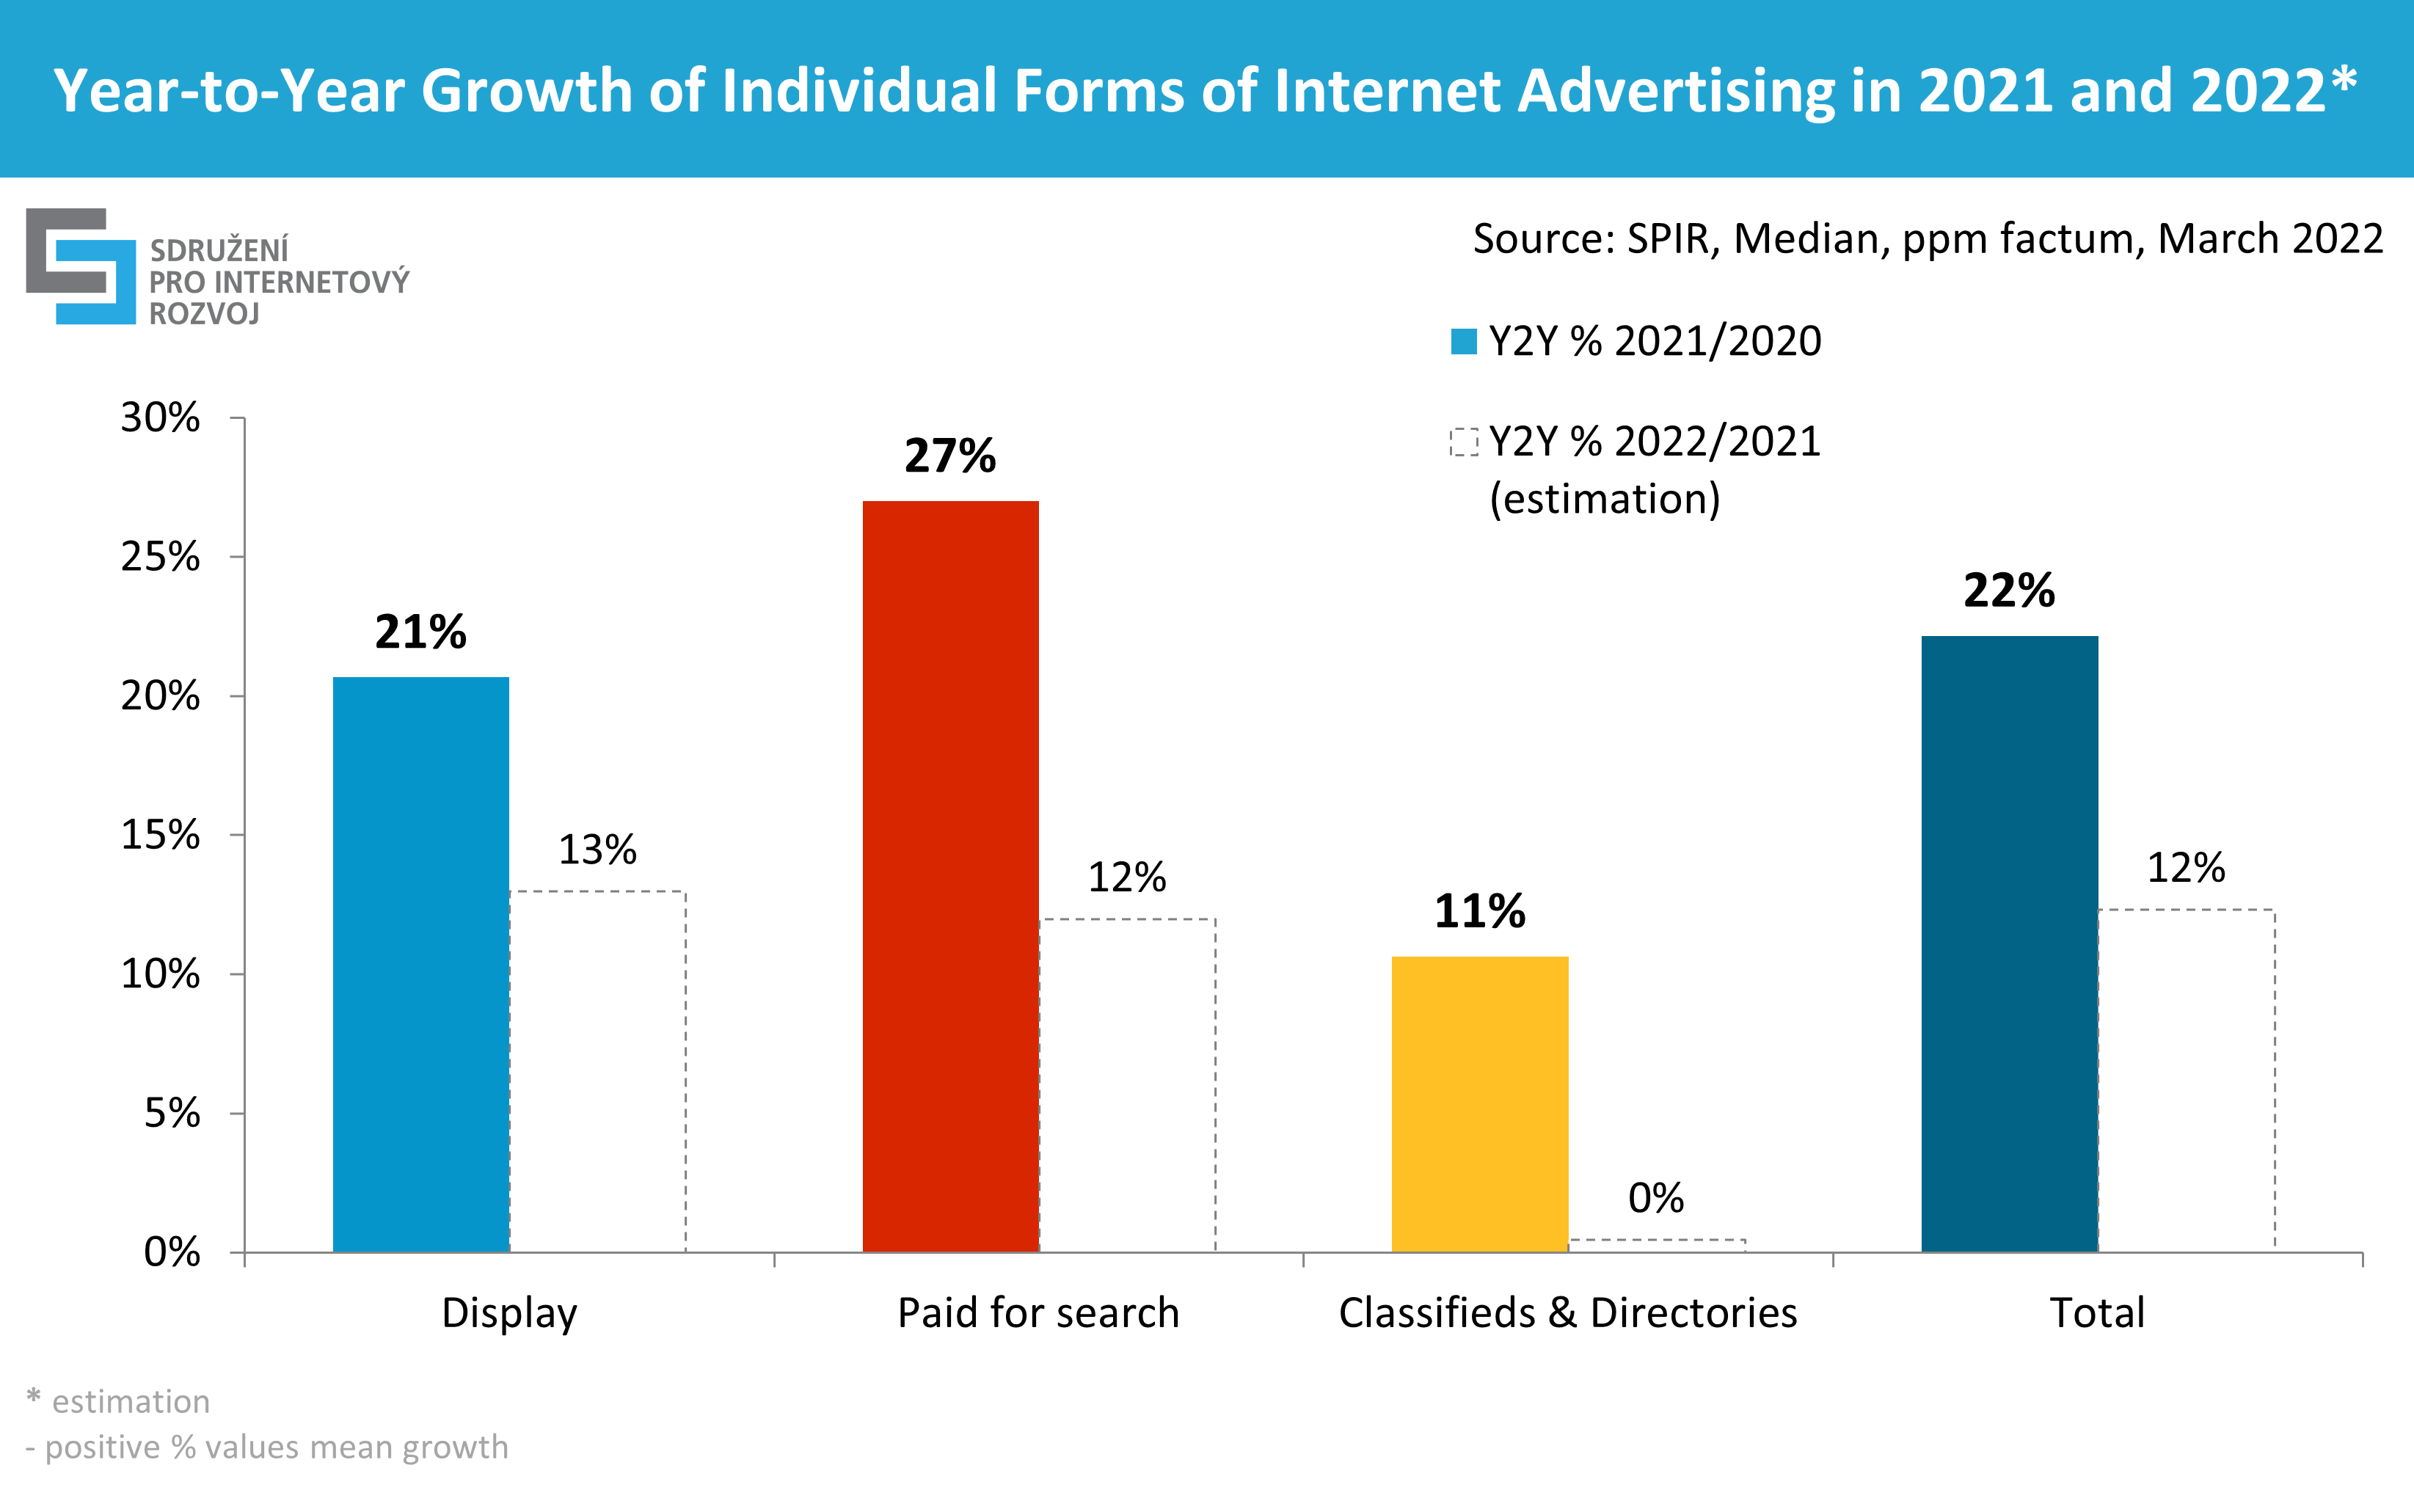
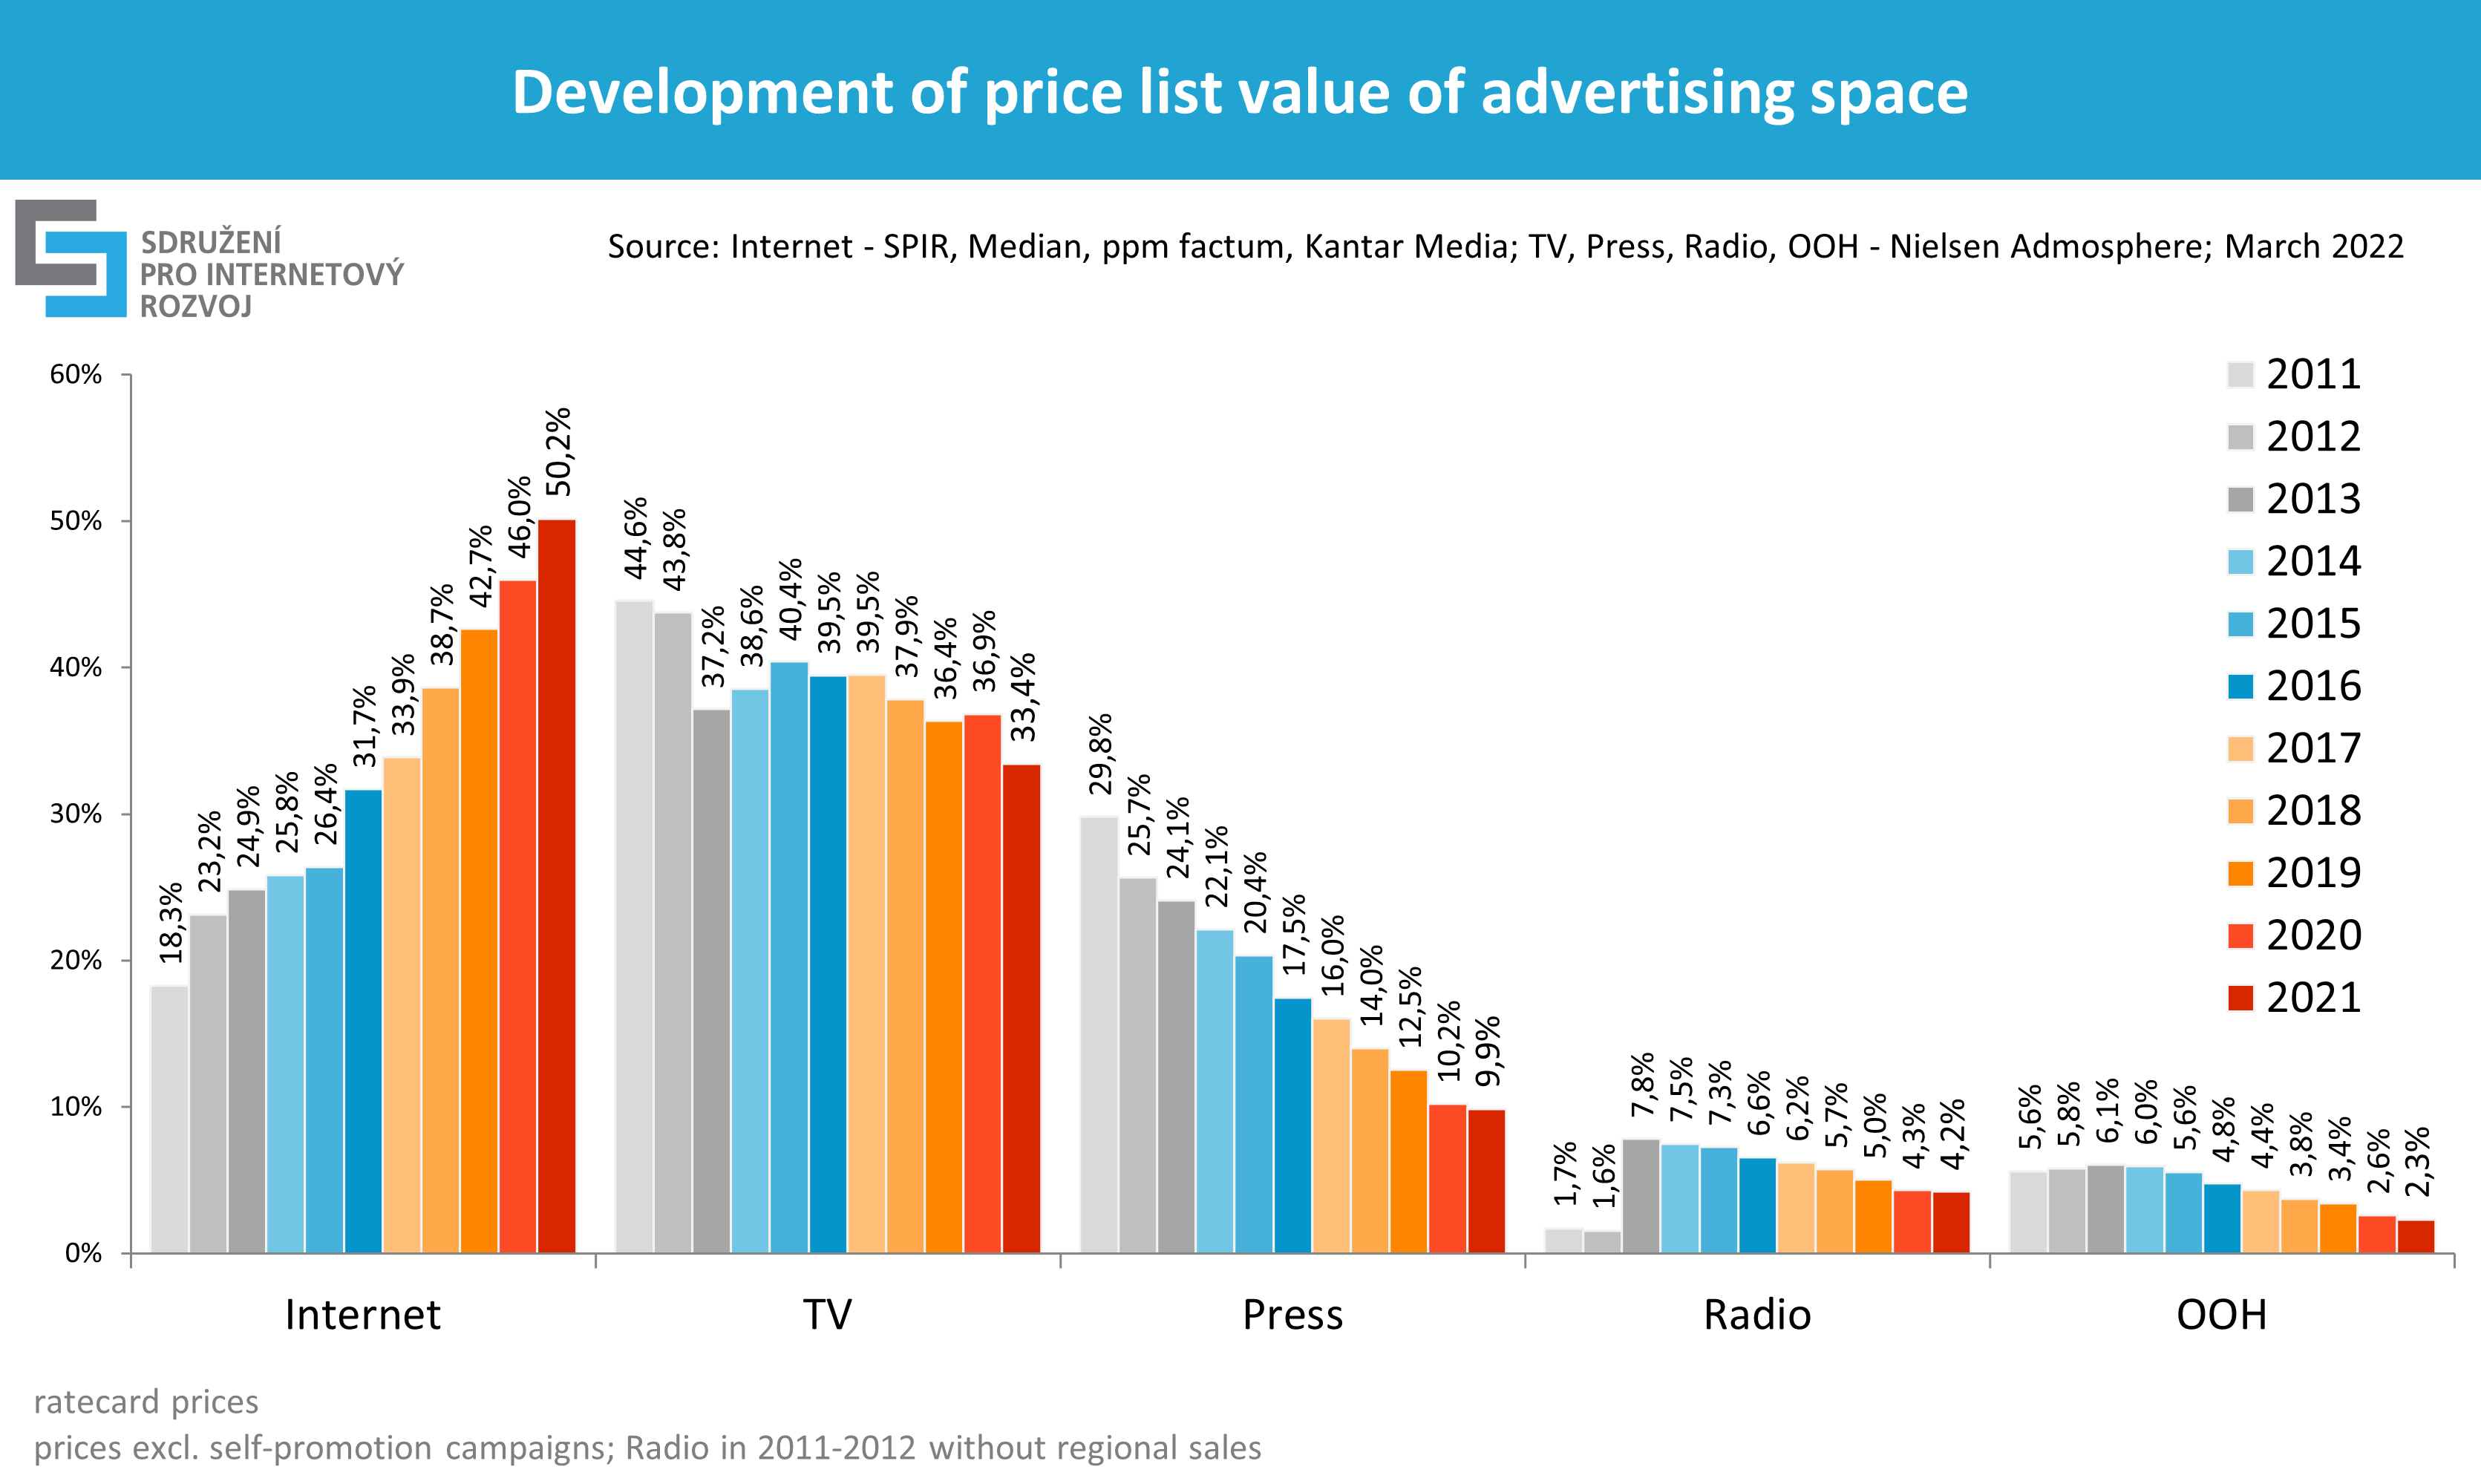
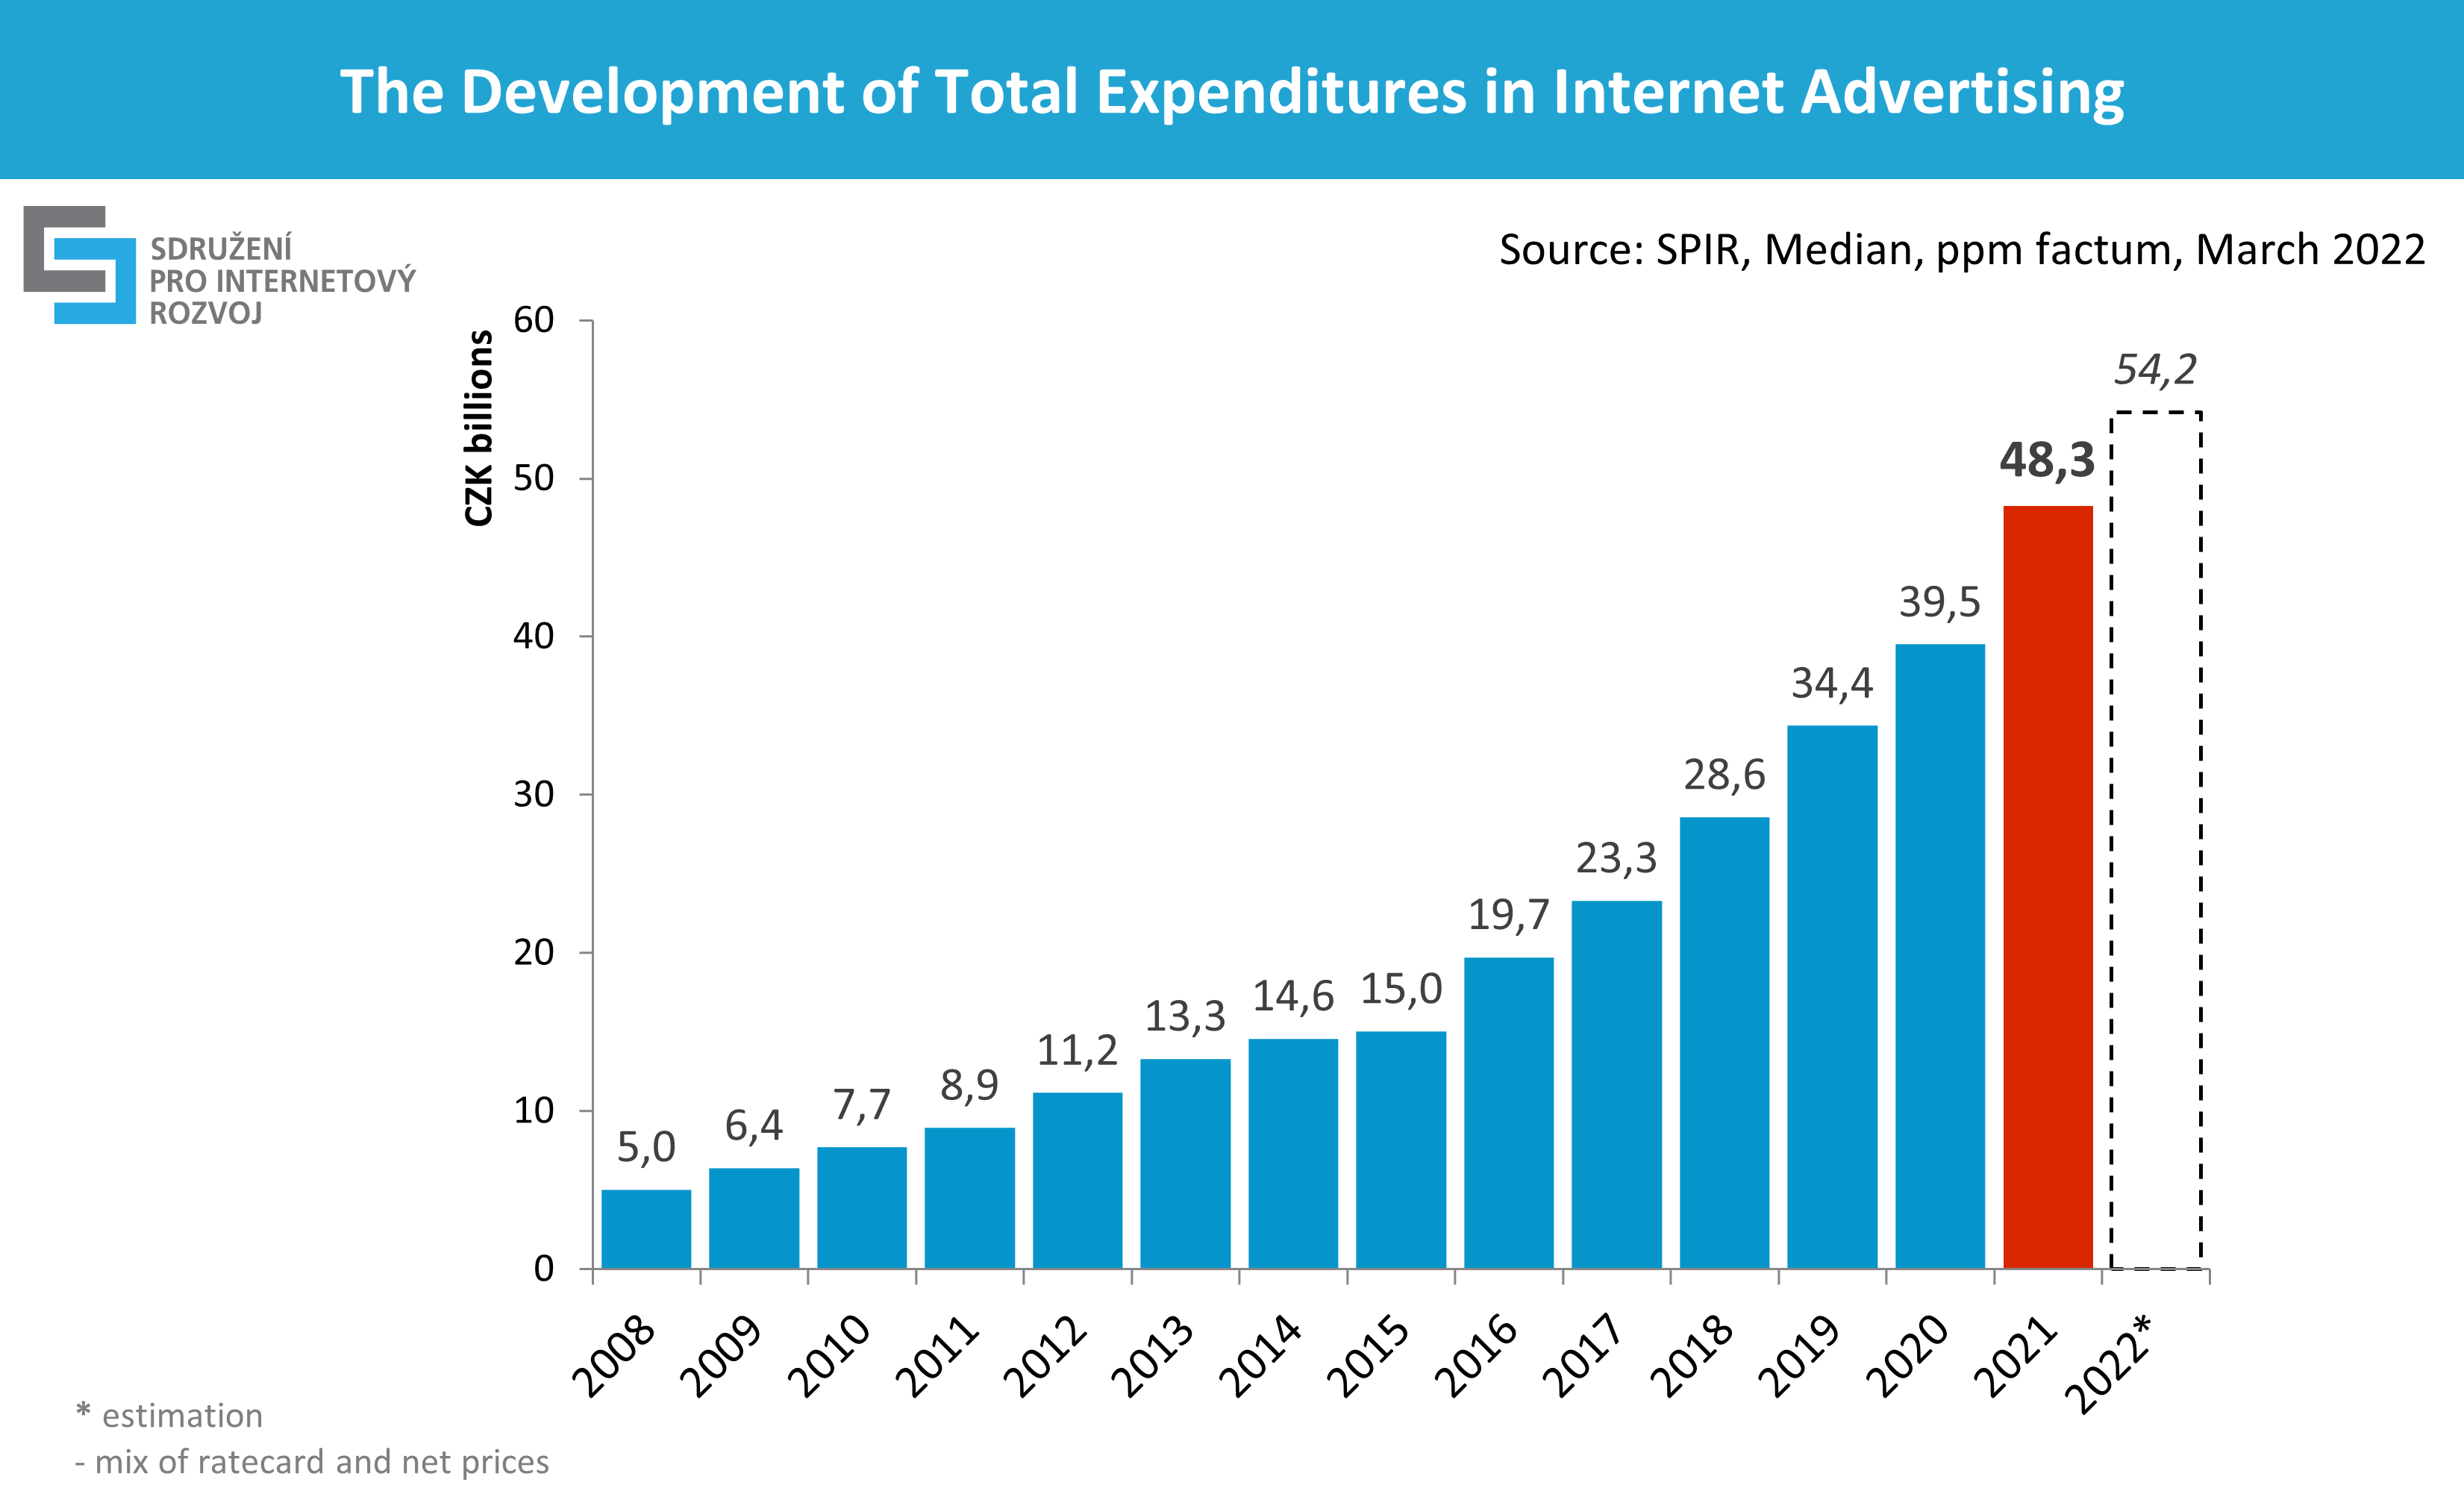 Source: SPIR, MEDIAN, ppm factum, March 2022