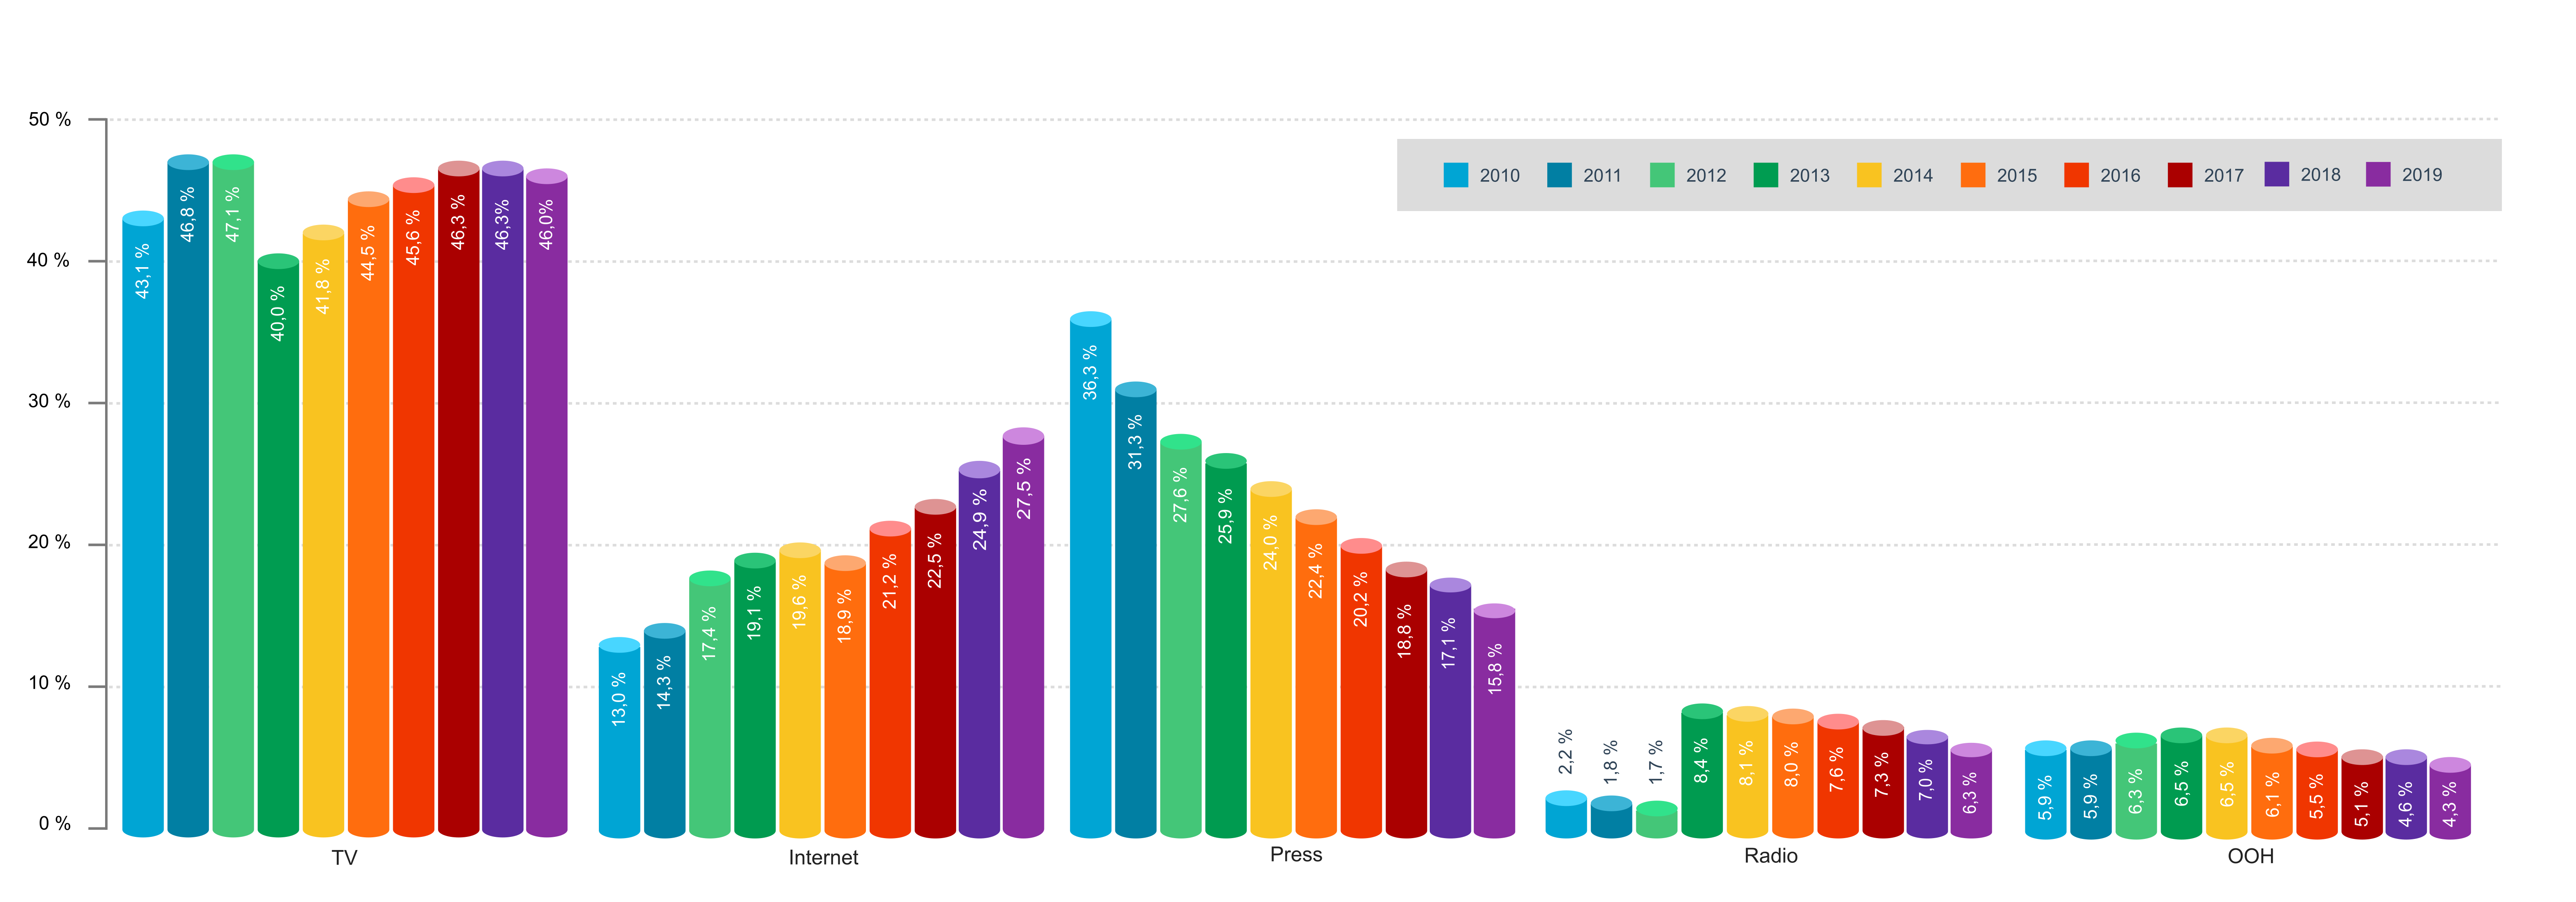
Share of Individual Advertising Forms in 2019
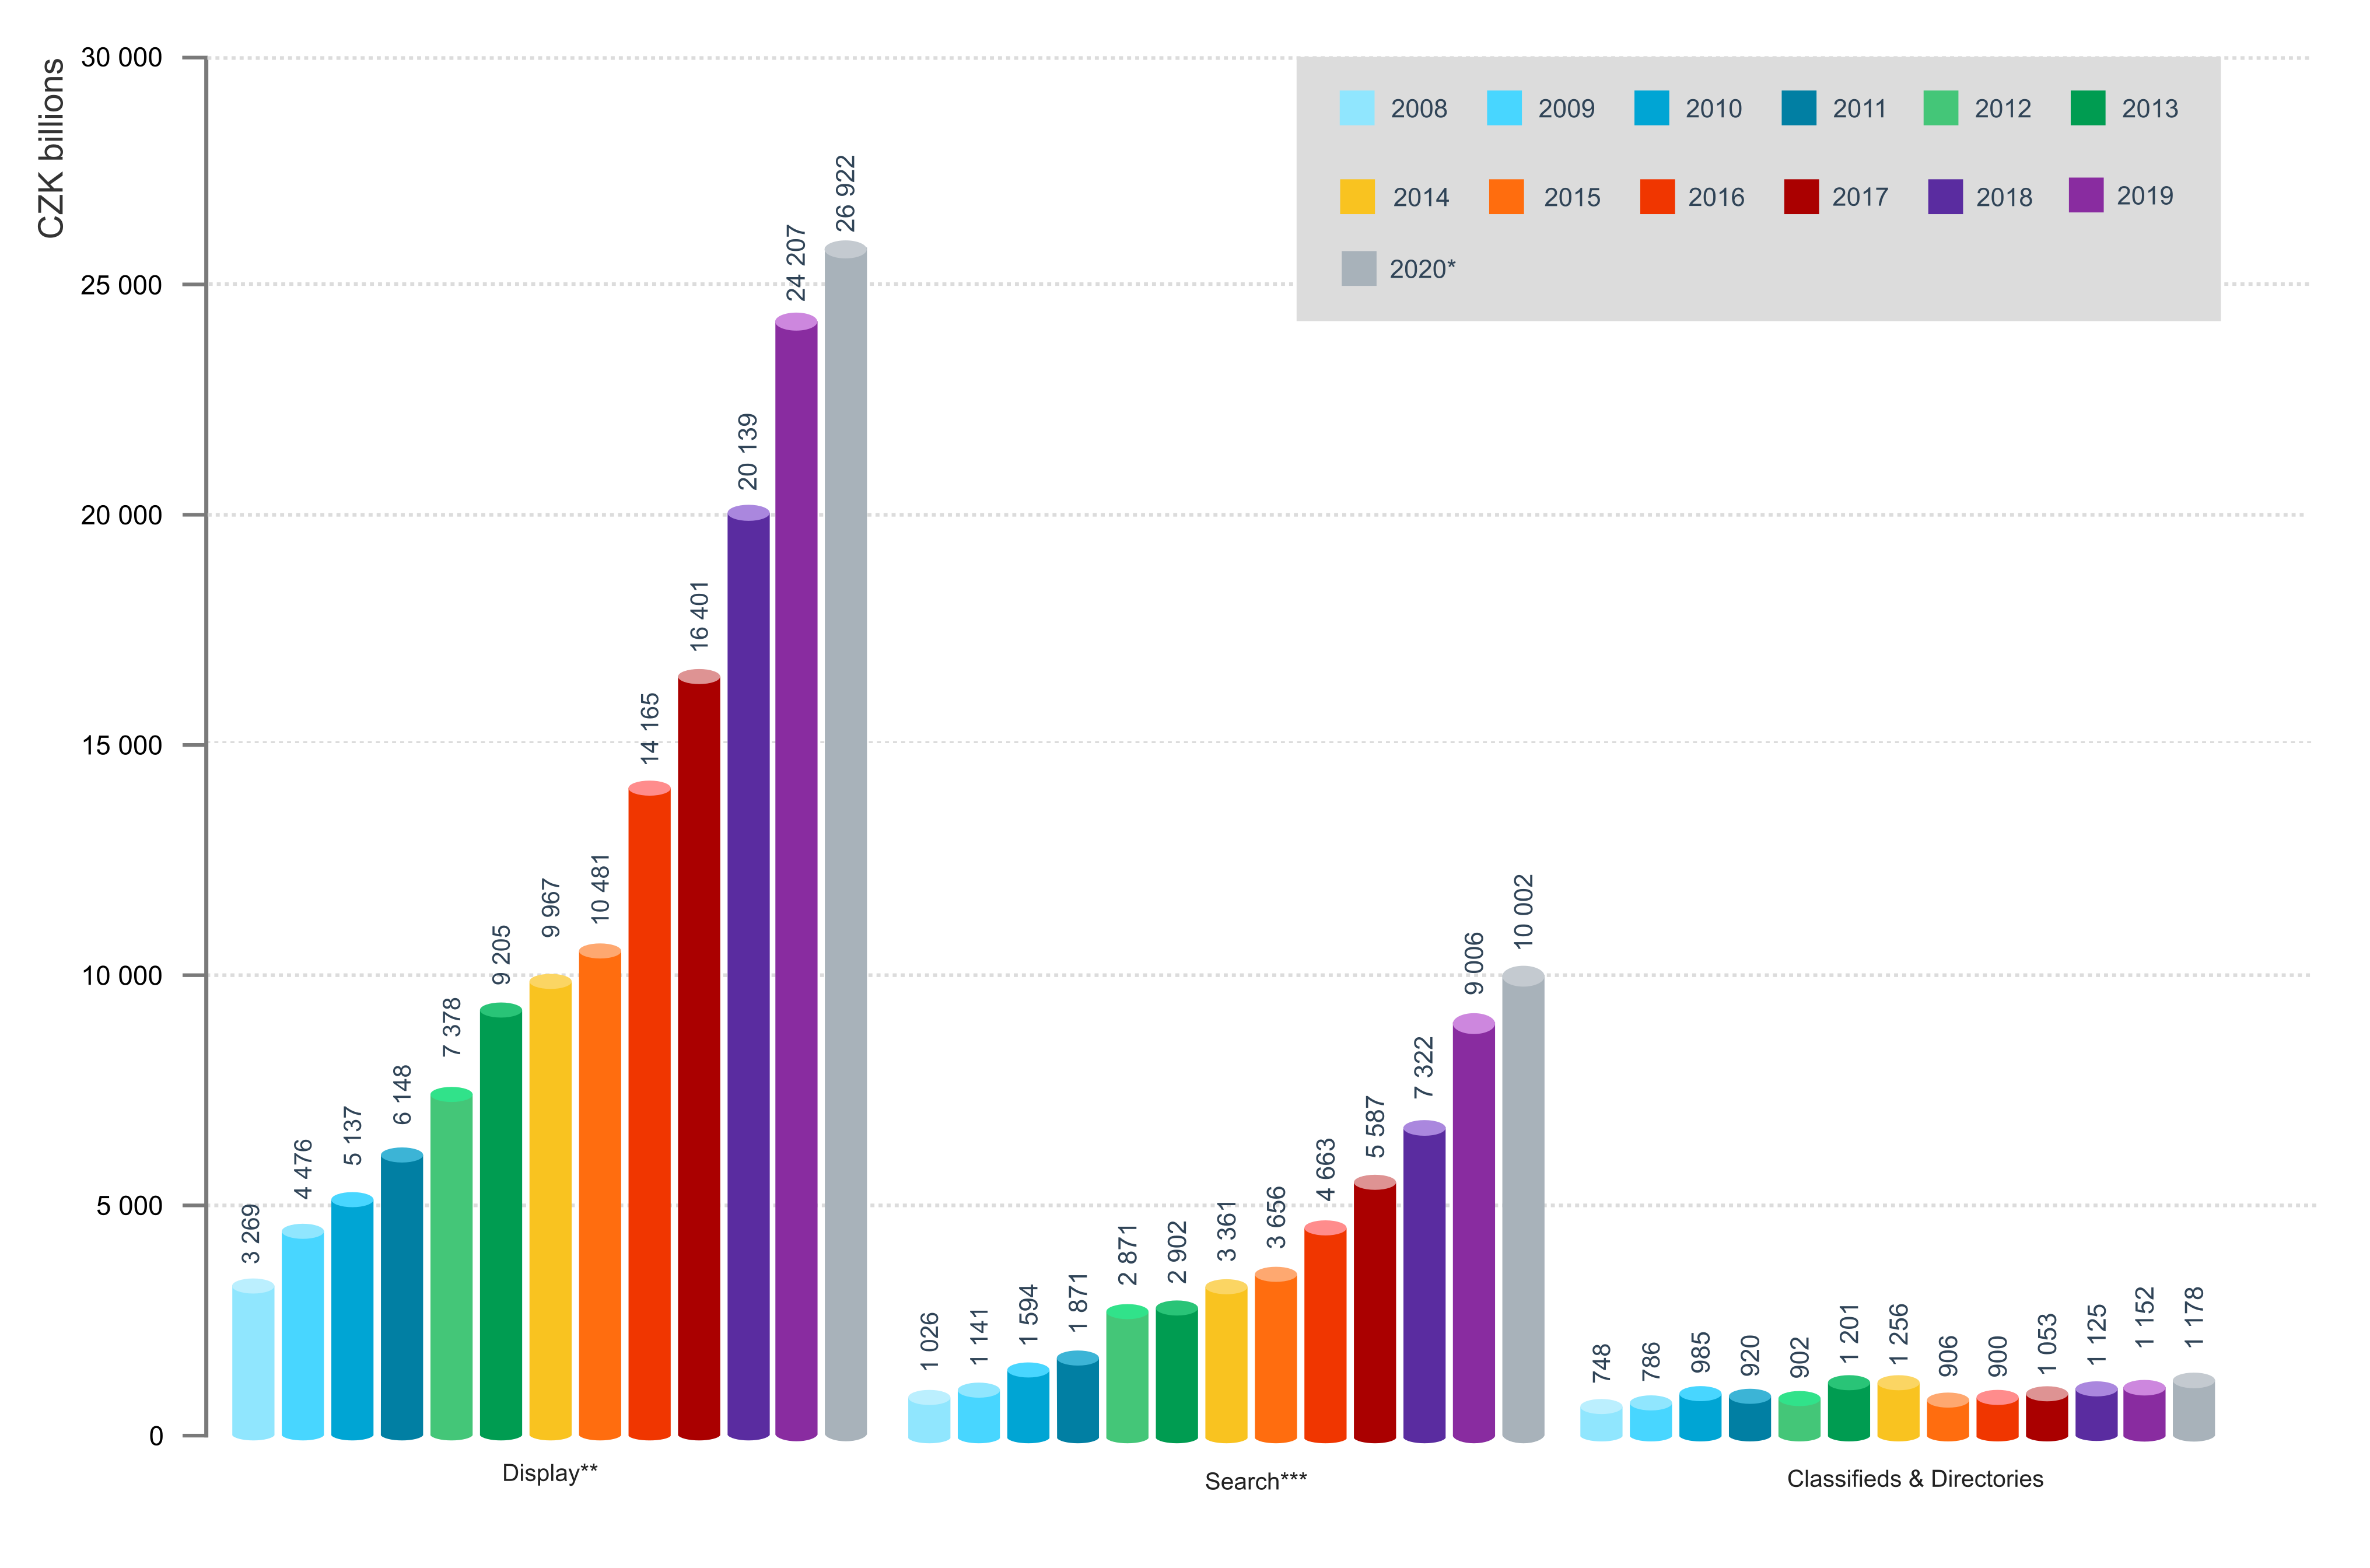
The largest part of advertising expenditures is attributable to display advertising (CZK 24,2 billion in ratecard prices). Display advertising includes also advertising in content networks (in particular Seznam Sklik, Google Ads and Facebook), and RTB. The second most frequently used advertising form is paid search with expenditures of CZK 9 billion in real prices. The sales in respect of classifieds and directories were declared in the amount of CZK 1,15 billion in ratecard prices.
Market share of Individual Internet Advertising Forms in 2019
 Source: SPIR, MEDIAN, February 2020
* net prices
others in ratecard prices
Video advertising represented a 29 per cent share of the overall display advertising (CZK 6,95 billion), i.e. a 37 per cent year-to-year increase, and is expected to grow by 11 per cent in 2020. Native advertising had a 11 per cent share (CZK 2,67 billion). In this year's survey, native advertising was also identified from programmatic advertising, not from directly sold display ads, so the value of native advertising for 2019 is so much higher than for 2018 (CZK 622 million). It is therefore not an organic growth.
Split of Display Advertising in 2019
 Source: SPIR, MEDIAN, February 2020
– ratecard prices
The share of mobile advertising out of the overall display advertising was 34 per cent (CZK 8,25 billion), i.e. a 39 per cent year-to-year increase, and is expected to grow by 13 per cent in 2020. The survey’s objective was to determine the share of advertisements that were displayed on mobile devices, not only sold as mobile ads. Unfortunately, many declaring parties are not able to specify the share of real display on mobile devices and provide only the sales data. Thus we might assume that the real share of advertisements displayed on mobile devices would be even higher.
Programmatic forms of advertising, which is related to content networks and RTB, together represented a 64 per cent share (CZK 15,58 billion in ratecard prices) and increased by 25 per cent, if compared to the last year. Programmatic displays include the advertising performance of content networks (such as Seznam Sklik, Google Ads, Facebook, Instagram, and more) as well as the performance of advertising through DSP / SSP systems.
Mobile share of Display in 2019
 Source: SPIR, MEDIAN, February 2020
– ratecard prices
 Source: SPIR, MEDIAN, ppm factum, February 2019